Blog
Assessing your preemie’s growth in the NICU
By Olivia Mayer, RD, CSP, IBCLC
For premature and sick infants, being discharged almost always involves achieving growth goals. A baby’s care team frequently uses a tool called a growth chart to monitor the infant’s overall growth. The type of growth chart used to measure a baby depends on when the baby was born -- before 37 weeks’ gestation1 or after 37 weeks’ gestation.2 These charts provide guidelines on growth goals for weight, length, and head circumference (the distance around the head) based on chronological age. There are also some charts that assess a child’s proportionality -- how their weight relates to their length.2,3,4
But charts like these are not widely used or accepted as standard tools. When a baby is in the hospital, growth is typically measured at most daily and at least weekly. The goal is for a baby to grow at the healthiest pace possible -- neither too quickly nor too slowly. Informed by the data on growth charts, healthcare providers can make care decisions based on these measurements.
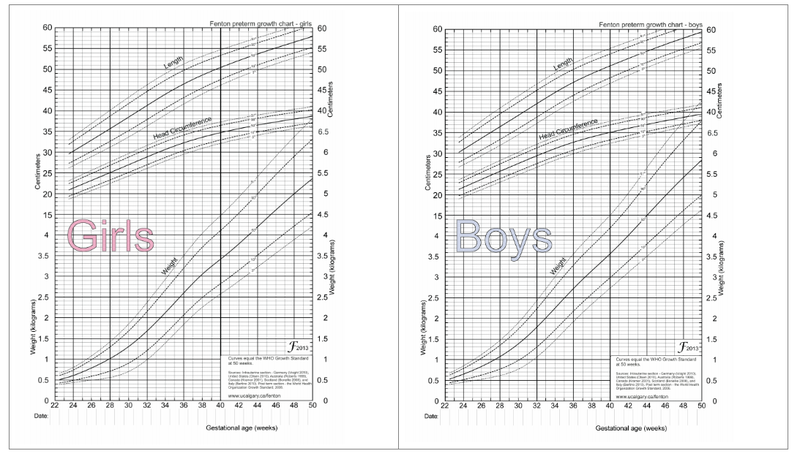
Fenton Growth Charts For Preterm Infants
Here are some answers to additional growth questions that preemie parents often ask:
How do I know what to look at on a growth chart?
Talk to your doctor, nurse, registered dietitian, or lactation consultant, and review the growth chart together.
Why do you measure the size of my baby’s head?
Measuring head circumference is the easiest, least invasive way to make sure your baby’s brain is growing properly.
What does it mean if my baby is at the top or the bottom of the growth scale on one measure or another?
Don’t worry! Neither extreme is necessarily a problem. Imagine one hundred babies, all born at the same gestational age, on the same day. First, rank these babies in order of weight. Then rank them according to length, and finally, by head circumference. It’s possible that the baby who ranked at the bottom for height may be ranked higher in terms of weight or head circumference. Each of these babies, though the same gestational age, will rank differently in the categories of height, weight, and head circumference. Some babies may even fall below the lowest line on the growth curve, and some may be above the highest line. But there may be a medical reason why a particular baby is an outlier on the growth curve. What is important for each and every baby is that their growth reflects a path that is similar to the lines on the growth curve.
References:
- Fenton TR, Kim JH. A systematic review and meta-analysis to revise the Fenton growth chart for preterm infants. BMC Peds. 2013;(13)59
- WHO child growth standards. World Health Organization website. https://www.who.int/childgrowth/publications/technical_report_pub/en/. Accessed February 12, 2019.
- Olsen 2015 BMI calculator for preterm infants. PediTools website. https://peditools.org/olsenbmi/. Accessed February 13, 2019.
- Fenton 2013 growth calculator for preterm infants. PediTools website. https://peditools.org/fenton2013/. Accessed February 13, 2019.